I. Chart 1
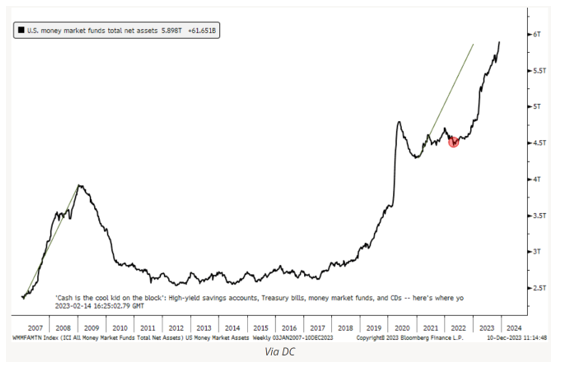
“The cash bubble” can supply the fuel for a significant USD weakening and asset rally”.
Tree Ring: Many have been looking for where the next bubble is, but our friend DC quietly posted the chart below showing that there is an epic “cash bubble”, with nearly 25% of US GDP sitting in cash and cash equivalents.
With the Fed now saying they will cut rates in 2024, we would expect this cash to eventually begin to spill out into other asset markets, driving asset inflation, nominal GDP growth, and US tax receipt growth. Eventually, it will likely drive inflation as well, but that is a worry for down the road.
VIA FFTT
II. Chart 2
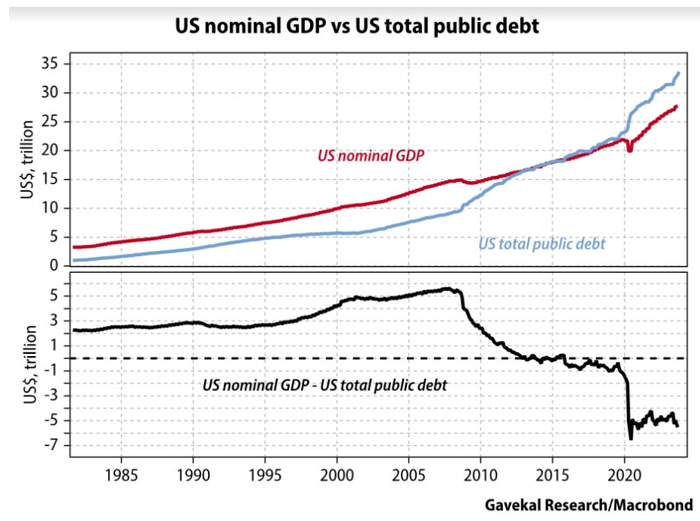
The bond market has been celebrating the Fed’s vectoring to begin cutting rates sometime in 2024. Long-term interest rates have plunged along with short-term rates. The market is now pricing in six rate cuts or 1½% (150 basis points) next year. If that is correct, holders of extended maturity U.S. Treasurys (USTs) might soon begin to have some misgivings. Such aggressive easing, should it occur, is arguably unfriendly to long-term bonds, especially when the Supercore Services CPI is running at 6%. Additionally, the federal deficit in the first two months of this fiscal year, which started on October 1st, was hemorrhaging even more red ink than a year ago, as hard as that is to believe.
October and November saw the deficit rise by $47 billion over last year’s budget-busting first two months to $383 billion. In other words, that’s a $190 billion per month deficit rate. (If not for a timing shift of some government outlays, the deficit increase would have amounted to $56 billion.) The culprit wasn’t a revenue deficiency this time; tax receipts rose by $108 billion, but spending vaulted by $156 billion. This onslaught of bond supply to fund this budget shortfall threatens to overwhelm buyers, despite the current enthusiasm for bonds of all maturities, particularly on the already-fragile long end. Unfortunately, the below chart illustrates the negative fiscal multiplier, as frequently described by the illustrious Lacy Hunt. In other words, total economic activity (nominal GDP) is now increasing by less than the growth in federal debt.
VIA GAVEKAL RESEARCH
III. Chart 3
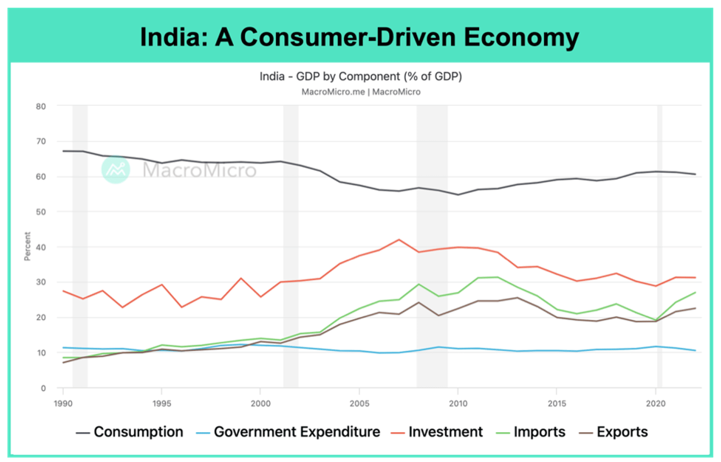
India - a consumption-driven economic structure similar to the United States - maximizes its industrial upgrading and demographic dividend, allowing it to maintain impressive economic growth despite a slowdown in global trade, manufacturing and frequent geopolitical risks throughout 2023. Observing the details of expenditure, one key factor contributing to India's GDP growth exceeding expectations is the nearly 60% share of private consumption. Despite the high base pressure over the past two years, this category maintained stable growth rates of 2.83%, 5.97%, and 3.13% in Q1, Q2 and Q3 respectively. The year-on-year growth of personal bank loans—a measure of consumer willingness to spend - reached 32.6% in October, hitting a new high. In September, the Consumer Confidence Survey Index also jumped, surpassing pre-pandemic levels, cementing the fact that household spending played a pivotal role in economic momentum. Another key factor comes from the second-highest share of GDP, gross fixed capital formation. With a year-on-year growth rate reaching 11.3% in Q3, this reflects the continued vibrancy in domestic investment demand. This is mainly due to accelerated investment by global manufacturing companies and the government's efforts to attract foreign investment through expanding infrastructure investments.
VIA MACROMICRO
IV. Chart 4
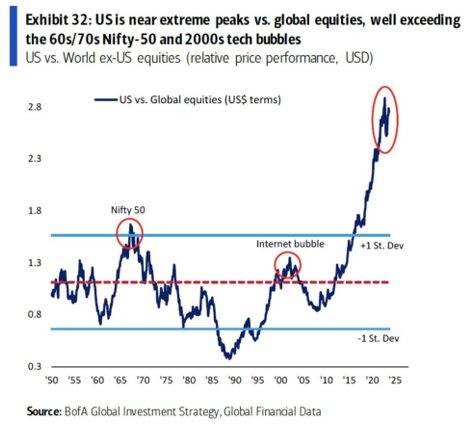
US stocks have an exorbitant valuation compared to global equities. Primarily propelled by technology firms, the current environment stands out as one of the most speculative periods for American stocks in history. The next decade is poised for a substantial mean reversion in the chart below, presenting one of the best opportunities to invest in foreign markets. We believe that economies abundant in natural resources, along with gold and other hard assets, are poised to emerge as significant beneficiaries in the upcoming cycle.
VIA CRESCAT CAPITAL
V. Chart 5
Never bet against America.
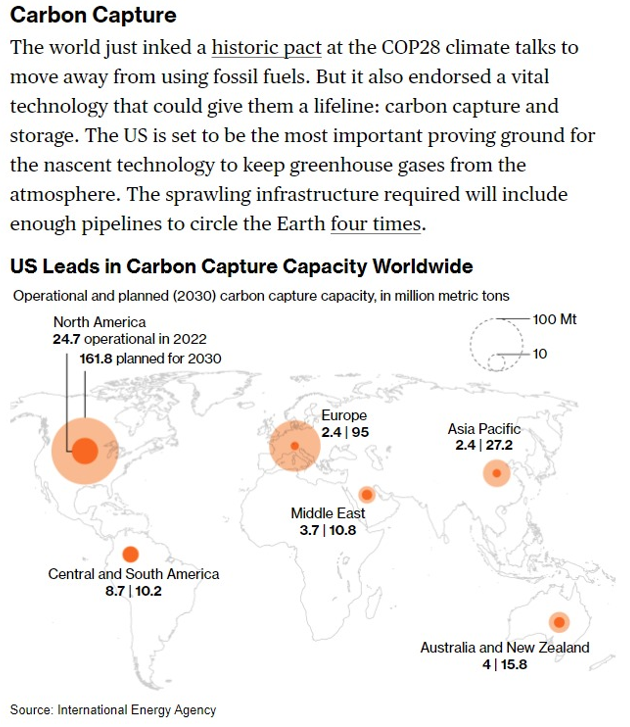
VIA IEA
VI. Chart 6
VIX "not buying it".
VIX has held pretty much the same levels since late November, despite the fact that the SPX has squeezed higher since early December. We saw a similar type of short-term "divergence" in July 2023 that lasted for weeks before the market eventually rolled over.
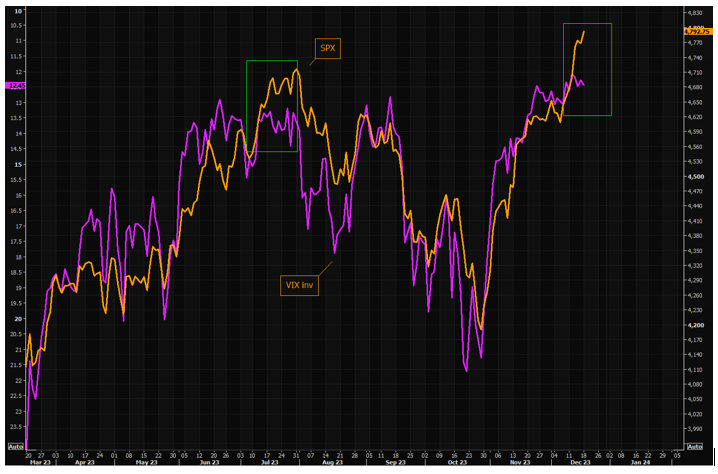
VIA MARKETEAR
VII. Chart 7
ELECTRIFICATION
At present, 62% of the energy delivered as electricity comes from fossil fuels; that has to come down to more or less zero. A lot of its replacement will be in the form of cheap wind and solar, and that presents a serious challenge to grid operators. It means a lot of new connections, which are troublesome. The problem is exacerbated by the fact that renewable installations typically generate less power than steam turbines do. That means more connections per unit of capacity. As well as adding a great many new connections, grids will also have to change shape. The places best suited to the generation of renewable energy in very large amounts are often not the places where today’s generation is concentrated. So new transmission lines will be needed. And because grids are complicated things, some of those expansions will require compensating changes elsewhere as bits of the grid become congested. Renewables are also intermittent. An obvious way to lessen this problem is to expand grids so that they can access renewable resources over larger areas. Even if this is done, grids in which renewables play a large role will require connections to a lot of new energy storage. Some will be located alongside the renewables; some will not, complicating things further. To ease the storage challenge, grids will also need access to demand-management systems through which they can reduce demand on various different time scales. Last of all, various ways in which grids are controlled and balanced today are physically rooted in the way steam turbines generate power. They will need to be rethought. In the long run, this is a welcome opportunity to make the system cheaper and more reliable. In the short term, it is a requirement for yet more investment.
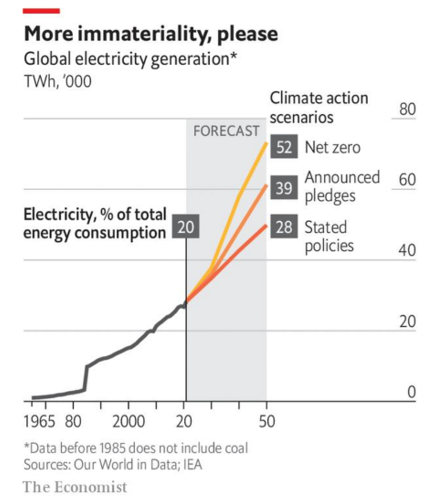
VIA THE ECONOMIST
VIII. Chart 8
Every investor avoiding China like a plague.
In another sign that people still want to invest in EM if they can avoid China - the iShares ETF that strips China from the EM world has overtaken the China ETF in assets this year for the first time.
We like China and it’s a part of Pinetree portfolio.
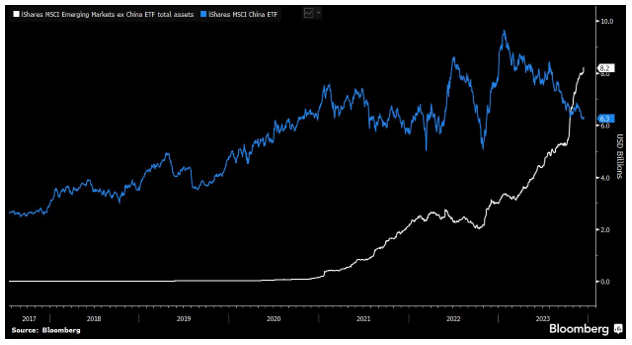
VIA BLOOMBERG
IX. Chart 9
We are back boys…don’t listen to us but watch what we do.
Oct 2022…UK gilt markets froze because Fed was withdrawing liquidity from global markets. They increased the liquidity immediately to support UK gilts.
They again tried taking out liquidity and by March 2023 we had SVB fiasco (SPX bottomed at 3,800) and again they increased the liquidity to support the asset markets.
(Fed liquidity is more immediate - short term injection of money into markets)
Now that liquidity is rising again, since in recent days and as per Crossborder Capital,..2024 will be the year of increase in global liquidity with 1/3rd of global central banks easing policy.
VIA CROSSBORDER CAPITAL
X. Chart 10
The longstanding Indian success story has been IT exports. But recent years have seen a surge in service sector exports, in addition to IT services.
One aspect of this is the growth in so-called “Global Capability Centres” (GCCs) where multinationals base their global IT operations in India. Revenues from this area are now US$46bn. So, this is an area where globalization is definitely not yet in retreat.
Thus, net exports of services have risen from US$84bn in 2020 to an annualized US$156bn in October 2023.
VIA GRIZZLE
XI. Chart 11
US financial conditions are the most accommodative they've been since the Fed started hiking rates last year, according to the Bloomberg US Financial Conditions index.
VIA LISA ABRAMOWICZ


 Register on SCORES Portal LEDO