"Investments are subject to market risk…" - This is a familiar line for all investors. We generally come across this line while reading any material that describes any investment option - be it a stock idea or a mutual fund offer document or any other investment plan. Most retail investors have an overall but usually vague idea about what it means or what exactly to look at.
For instance, when we buy a stock or we are in the process of buying one, we always tend to be watchful of how it is performing and how it is expected to perform in the coming days. We know we have to look at not just the stock but the broader picture - elements that will determine the positive outcome. We tend to look at how the sector or industry is doing? What are the opportunities or threats? Whether the products or services the company sells will continue to be in demand? How interest rates would affect the returns etc. etc.
The crux of the matter is that we need to see the greater picture to make sure that we understand the possibilities of our investment(s) doing well or not over the investment horizon and what are the factors that could possibly impact this outcome. This is called the macro view or the macroeconomic view. The EF macro dashboard is one of Eastern Financier's (EF's) several efforts to help investors make an informed decision regarding picking an investment product - be it mutual funds or stocks.
Before we go into the details of the variables displayed in this dashboard, let's just quickly run through the concept of macro economy and understand why investors should be aware of them. Macro economy talks about the economy at the national or global levels, rather than the individual levels. It talks about the overall investment environment, the industries, sectors etc.
For any lay investor, understanding macroeconomics is essential because it provides the "big picture" context - which includes such elements as interest rates, inflation, and GDP growth - that drives the overall market trends, dictates asset class performance, and helps manage risk, even if they are not actively trading. Understanding these factors helps investors avoid investing against the tide and allows for better asset allocation across stocks, bonds, and cash.
The Indian stock market movement is the reflection of a combination of factors -such as company performance, sector developments and broader economic forces. Understanding macroeconomic factors helps investors better interpret these market movements and be aware of the economic environment that shape the stock price behaviour. These forces cannot be predicted with hundred percent accuracy. However, staying informed can help an investor make more careful financial decisions. The stock market also impacts the mutual fund markets driving the NAVs. Hence, being able to comprehend the macro scenario pays off in mutual fund investment as well.
First rolled out in November 2023, EF's Macro dashboard is now published every month to exhibit few of the key macro-economic variables that are either leading or lagging indicators of how the economy is faring and the direction in which it is headed.
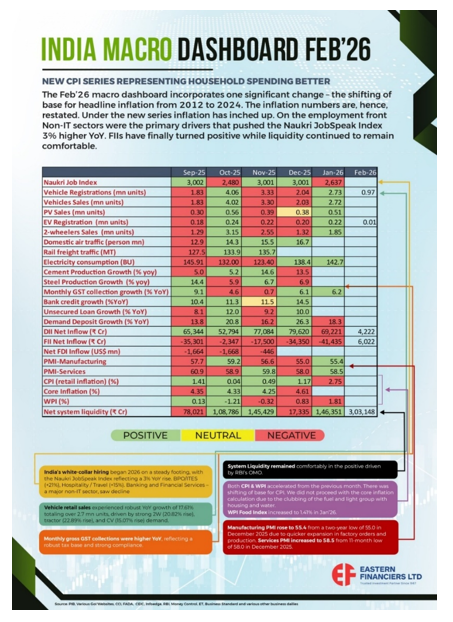
The EF macro dashboard showcases both the demand and the supply sides of the economy. On the one hand, it gives the consumption data - automobile sales and registration numbers, electricity consumption, air passenger traffic, etc and on the other it also tries to highlight the supply side through data related to manufacturing such as cement and steel production, manufacturing and services PMI. It shows whether the economy is expanding or contracting and whether is all because of price changes of whether the growth is more because of the expansion of the real economy. Inflation numbers indicate whether the growth is just because of price rise. Rising output alongside moderation in inflation (price rise) is a healthy sign for the economy. Lower WPI (wholesale price index) indicate input costs have gone up moderately - this indicated lower pressure on the company's margins, which means better profitability without having to put the pressure on consumers. CPI or consumer price index measures the overall change in consumer prices for a basket of goods and services, representing total "headline" inflation. Core inflation is a subset of CPI that excludes volatile food and energy prices to show the long-term, underlying inflation trend. Monthly gross GST collection acts as a key indicator of economic health, consumption trends, and tax administration efficiency.
The Naukri JobSpeak Index is a monthly indicator of white-collar hiring activity in India, that tracks hiring trends based on new job listings and recruiter searches. It analyzes demand across industries, cities, experience levels, and functional areas to provide a snapshot of the employment market. The job market growth has a bearing on consumption demand. Higher growth indicates higher job creation and points towards greater consumption demand. It is a leading indicator of India's white-collar job market and broader economic activities.
The Macro Dashboard shows whether funds are flowing into the market or out of it and its sources - the FII and DII data. If the numbers are in the red it shows the institutions are selling shares. That generally indicates profit booking but a sustained period of selling shows lack of confidence in the economy. It creates a selling pressure. If both numbers are moving in tandem and in the red and consistently over months, then it is a definite red flag. The market sentiment is negative. If that is accompanied by the PMI numbers below 50, then the economy is in a contractionary phase. Whether depression is setting in will be evident over a longer period. The key is to watch the numbers over a prolonged period - over a number of months. Hence, our macro is published every month rather than every quarter. It gives a closer picture of the existing economic trends, the emerging economic trends, and an early indication of a trend reversal.
The macro dash board presents historical data over a 6 months period, that are collected from various government sources and renowned websites to ensure the maximum authenticity of the data. The aim is to provide better clarity to our investors on the state of the economy.


 Register on SCORES Portal LEDO